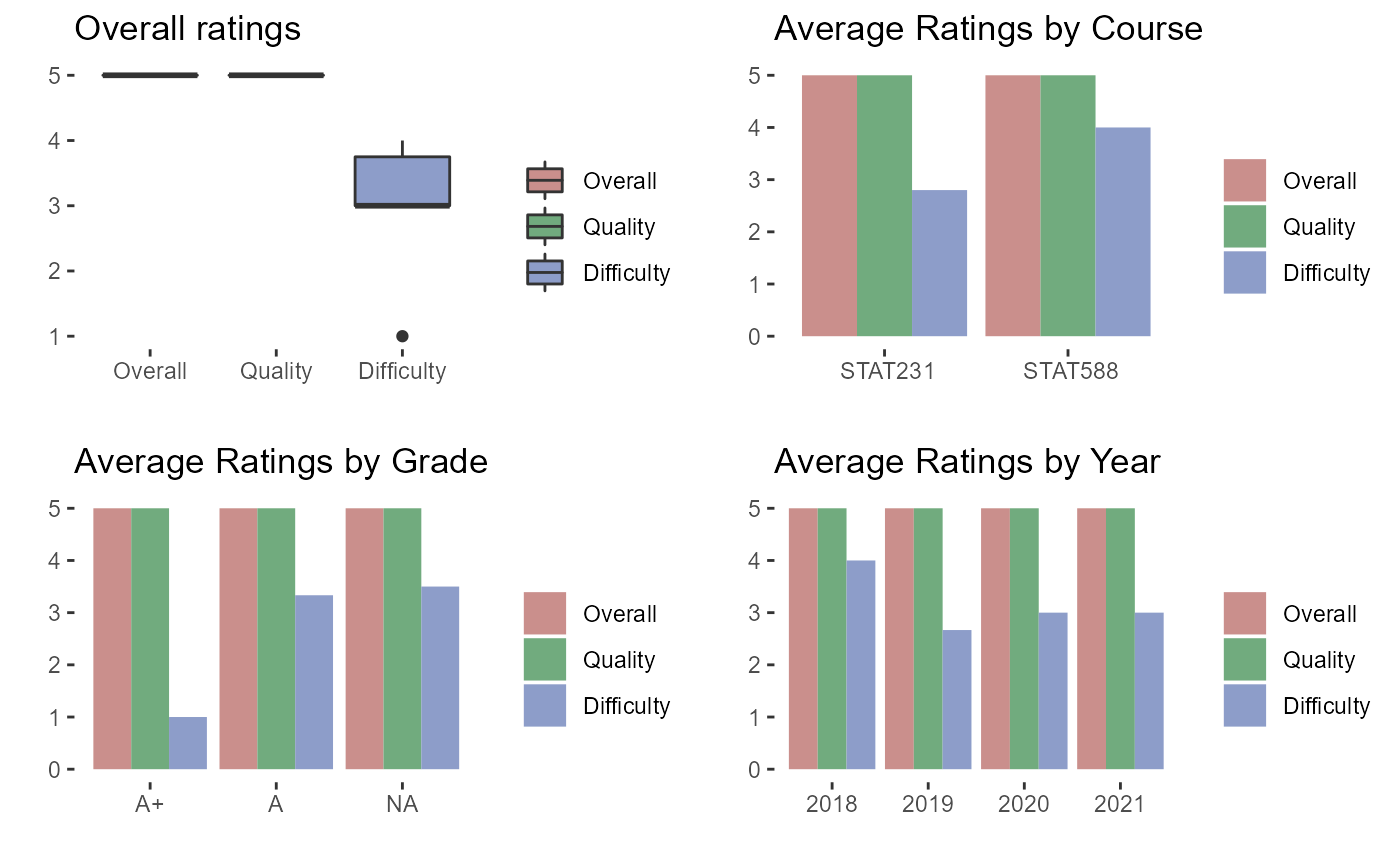
1 boxplot of all ratings and 3 barplots of average ratings by course, grade, and year.
ratings_plot(url, y = 2018)Arguments
- url
A character value indicating the URL of the professor's webpage.
- y
A numeric value to filter ratings after a certain year.
Value
A plot including 4 subplots
Examples
url <- 'https://www.ratemyprofessors.com/ShowRatings.jsp?tid=2036448'
ratings_plot(url = url)
