More details about the ProfRate package
Source:vignettes/ProfRate-in-detail.Rmd
ProfRate-in-detail.RmdThe homepage introduces the functionality of the ProfRate package. Here, we will get into more details and its applications for those who are interested.
Motivation
As a student, you might be interested to know more about a certain professor before registering for a course, for example, an overall course quality, the difficulty level, and comments from previous students. Luckily, the website Rate My Professor gathers various information on professors, and our ProfRate package will utilize them and assist the users to know their professors better at a glance.
This package mainly offers a user-friendly Shiny dashboard to visualize students’ feedback on a specific professor of interest. Users can also follow the examples and apply these powerful functions as helpers for other purposes.
What is this package for?
This package provides information and visualization on the following questions:
- What are the positive and negative words commented on a professor?
- What are the most frequently used positive and negative words?
- What are the overall rating, quality rating, and difficulty rating of a professor?
- Are the ratings of a professor differ among different courses?
- Do the ratings of a professor change over time?
- Do the grades of the students affect the ratings?
Who can use this package?
- Students:
- Get more familiar with a professor by looking at the feedback of peer students for learning purposes.
- Professors:
- Get constructive feedback on their strengths, weaknesses, and progress over time from students’ point of view for self-evaluation purposes.
Functions
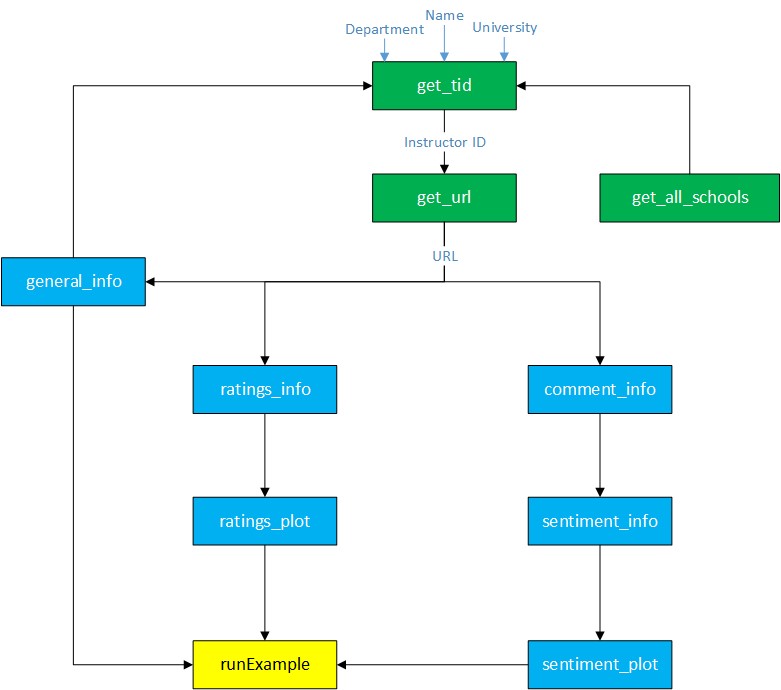
First, we have the following flowchart summarizing the relationship and dependence among all functions in this package:

There are ten functions in total. The first three functions in the green box generate the URL for the scraping procedure used in other functions. The next seven functions in the blue box are the body of the package responsible for summarization and visualization. The last one in the yellow box is used to launch the Shiny dashboard.
In short, firstly, a URL is generated using the professor’s name, department, and university name. Then the comments and ratings are scraped, summarized, and plotted. All the outputs are then visualized in the Shiny dashboard.
All functions that drive webscrapping use the polite package, and we do try our very best to be ethical scrapers. Let us know if there are any issues with using the website data, and we will modify it accordingly.
get_all_schools
- This function finds the university’s URL using its name.
- It can be used independently, and it is also used as a helper function to filter and find the professor of interest in the
get_tidfunction. - For future development, it can be used for campus evaluation as well.
Examples:
get_all_schools('Iowa State University')
#> [1] "https://www.ratemyprofessors.com/campusRatings.jsp?sid=452"
get_all_schools('MIT')
#> [1] "https://www.ratemyprofessors.com/campusRatings.jsp?sid=580"
general_info
- This function extracts general information on a professor.
- It takes a URL and extracts the professor’s name, department, and university.
- It can be used independently, and it is also used as a helper function to filter and find the professor of interest in the
get_tidfunction.
Examples:
general_info("https://www.ratemyprofessors.com/ShowRatings.jsp?tid=342455")
#> $name
#> [1] "John Bush"
#>
#> $department
#> [1] "Mathematics department"
#>
#> $university
#> [1] "Massachusetts Institute of Technology"
general_info("https://www.ratemyprofessors.com/ShowRatings.jsp?tid=744853")
#> $name
#> [1] "Mergel Sarah"
#>
#> $department
#> [1] "History department"
#>
#> $university
#> [1] "George Washington University"
get_tid
- This function extracts the professor’s ID and combines it with general information.
- The name argument is required to be a full name and the university argument is also required. The department argument is optional.
- The function uses
rvest::html_textto check nodes and regular expression to extract ids.
get_tid(name = 'Brakor', university = 'California Berkeley')
#> # A tibble: 1 x 4
#>       tID name          department         university
#>     <dbl> <chr>         <chr>              <chr>
#> 1 1031282 Katie Brakora Biology department University of California Berkeley
get_tid(name = 'Brakor', department = 'Biology', university = 'Berkeley')
#> # A tibble: 1 x 4
#>       tID name          department         university
#>     <dbl> <chr>         <chr>              <chr>
#> 1 1031282 Katie Brakora Biology department University of California Berkeley
get_url
- This function takes the same arguments as
get_tid. It assesses the tid(s) first and then generate the corresponding URL(s). - With this function, we can use name, department, and university as direct inputs for further functions. The advantage is that we can restrict the number of scraping to the minimum - only scrape once and then use URL as input for the future.
Examples:
get_url(name = 'Brakor', department = 'Biology', university = 'Berkeley')
#> [1] "https://www.ratemyprofessors.com/ShowRatings.jsp?tid=1031282"
comment_info
- This function extracts the comments together with the year and course for a given URL.
- It also extracts the number of thumbs up and down for each comment.
- This function can filter the comments and only show those after a specific year.
comment_info(url = "https://www.ratemyprofessors.com/ShowRatings.jsp?tid=1031282", y = 2000)
#>       course year
#> 1      IB131 2012
#> 2         AA 2010
#> 3      IB131 2008
#> 4  INTGB131L 2007
#>                                                                                                                                                                                                                                                                                                                                             comments
#> 1       She has high demands to memorize an incredible amount of information and on the actual test she actually only focuses on so few.  For example, you are "supposed" to know the attachment points of functions of every muscle in the human body, but barely even showed. This is literally the most memorization of any class yet at berkeley
#> 2                                                                                                                                                                                                                                                                        She is a great teacher. her way of teaching is excellence i like her v much
#> 3                                                                                                                                                                              Katie was always willing to help if there was anything she wasn't sure of the answer. Very encouraging and had great tips for how to study and succeed in the course.
#> 4 Katie Brakora is one of the GSA's for Anatomy Lab (INTEGBIO 131L).  She comes unprepared, is very unhelpful and her quizzes are extremely difficult (she asks questions about the minutia of the material, you never know what MINOR detail out of the reading she  quiz on).  She never seems to know the answer to any questions asked in class.
#>   thumbsup thumbsdown
#> 1        0          0
#> 2        0          0
#> 3        0          0
#> 4        0          0
comment_info(url = "https://www.ratemyprofessors.com/ShowRatings.jsp?tid=1129448", y = 2000)
#>      course year
#> 1  ENGWR340 2011
#> 2     RDENG 2009
#>                                                                                                                                                                                                                                                                comments
#> 1 His class isn't too hard, but he's is not helpful at all. He never talks about how to writer, like how to create scenes or characters or the business, but instead he talks about himself a lot. What's he's editing or working on. A lot of time is wasted in class.
#> 2                                                                                                                                                                       AT FIRST I HAD MY DOUBTS BUT AFTER ALL HE IS A GREAT TEACHER VERY HUMOROUS AND EASY TO TALK TO.
#>   thumbsup thumbsdown
#> 1        0          0
#> 2        0          0
sentiment_info
- This function does sentiment analysis on the comments and generates sets of positive and negative words with their number of occurrences.
- It can also show tags from the website with the number of occurrences.
- User can decide which set of words/tags to show.
- It can filter from a certain year up to the present.
Example:
sentiment_info(url = "https://www.ratemyprofessors.com/ShowRatings.jsp?tid=69792", y = 2009, word = 'Positive')
#> Joining, by = "word"
#> # A tibble: 28 x 2
#> # Groups:   word [28]
#>    word          n
#>    <chr>     <int>
#>  1 best          4
#>  2 great         4
#>  3 enjoyed       3
#>  4 helped        2
#>  5 helpful       2
#>  6 nice          2
#>  7 amazing       1
#>  8 avid          1
#>  9 awesome       1
#> 10 enjoyable     1
#> # ... with 18 more rows
sentiment_info(url = "https://www.ratemyprofessors.com/ShowRatings.jsp?tid=69792", y = 2000, word = 'Negative')
#> Joining, by = "word"
#> # A tibble: 9 x 2
#> # Groups:   word [9]
#>   word             n
#>   <chr>        <int>
#> 1 bad              1
#> 2 bleed            1
#> 3 conservative     1
#> 4 hate             1
#> 5 loose            1
#> 6 rejects          1
#> 7 sour             1
#> 8 stress           1
#> 9 worthless        1
sentiment_info(url = "https://www.ratemyprofessors.com/ShowRatings.jsp?tid=69792", y = 2009, word = 'Tags')
#> Joining, by = "word"
#> # A tibble: 6 x 2
#> # Groups:   tags [6]
#>   tags                      n
#>   <chr>                 <int>
#> 1 Inspirational             3
#> 2 Respected                 3
#> 3 Gives good feedback       2
#> 4 Graded by few things      1
#> 5 GRADED BY FEW THINGS      1
#> 6 Participation matters     1
sentiment_plot
- This function visualizes the output of the
sentiment_infofunction using a word cloud. - It can generate plots corresponding to positive words, negative words, and tags , respectively.
- It can filter from a certain year up to the present.
Examples:
sentiment_plot(url = "https://www.ratemyprofessors.com/ShowRatings.jsp?tid=69792", y = 2009, word = 'Positive')
#> Joining, by = "word"
ratings_info
- Given the URL, it extracts and summarizes all rating information on an professor.
- It creates a list of three outputs:
- a number of comments
- a table including the year, course, quality, difficulty, and overall rating with some other information regarding the course or the student
- a table of summary statistics of the above table.
Examples:
ratings_info("https://www.ratemyprofessors.com/ShowRatings.jsp?tid=1129448", y=2009)
#> $n
#> [1] 2
#>
#> $ratings
#>   Year    Course Overall Quality Difficulty Take_again For_credit Textbooks
#> 1 2011  ENGWR340       1     2.0          2         NA         NA     FALSE
#> 2 2009     RDENG       3     3.5          2         NA         NA      TRUE
#>   Attendance Grade
#> 1         NA  <NA>
#> 2         NA  <NA>
#>
#> $summary
#>   avgRating avgQuality avgDifficulty percentTakeAgain percentForCredit
#> 1         2       2.75             2                0                0
#>   percentTextbook percentAttendance
#> 1              50                 0
ratings_plot
- Given the URL, it generates the visualization for the ratings.
- It creates four subplots:
- one boxplot of all ratings
- three barplots of average ratings by course, grade, and year
ratings_plot("https://www.ratemyprofessors.com/ShowRatings.jsp?tid=1129448", y=2009)
Testing
We included different tests for each function to make sure that they work properly as we expect. The test coverage of the package is 98%. The only function that is not tested is the runExample function, which is used to launch the Shiny dashboard. Here is the set of things we checked for each function in general:
- Checking the data type
- Verifying the length of inputs and outputs
- Correct format of the URL
- Correct set of arguments
- Error messages from the input or output checks embedded in the functions
- Checking plot reproducibility
Documentation
Each function is documented thoroughly. The set of information included in each function is as below:
- Name and description
- Usage
- Arguments and their definition
- Outputs and their definition
- Examples
Website
The website is launched and includes references, examples, and other useful information like this vignette on how to use this package.
Shiny dashboard
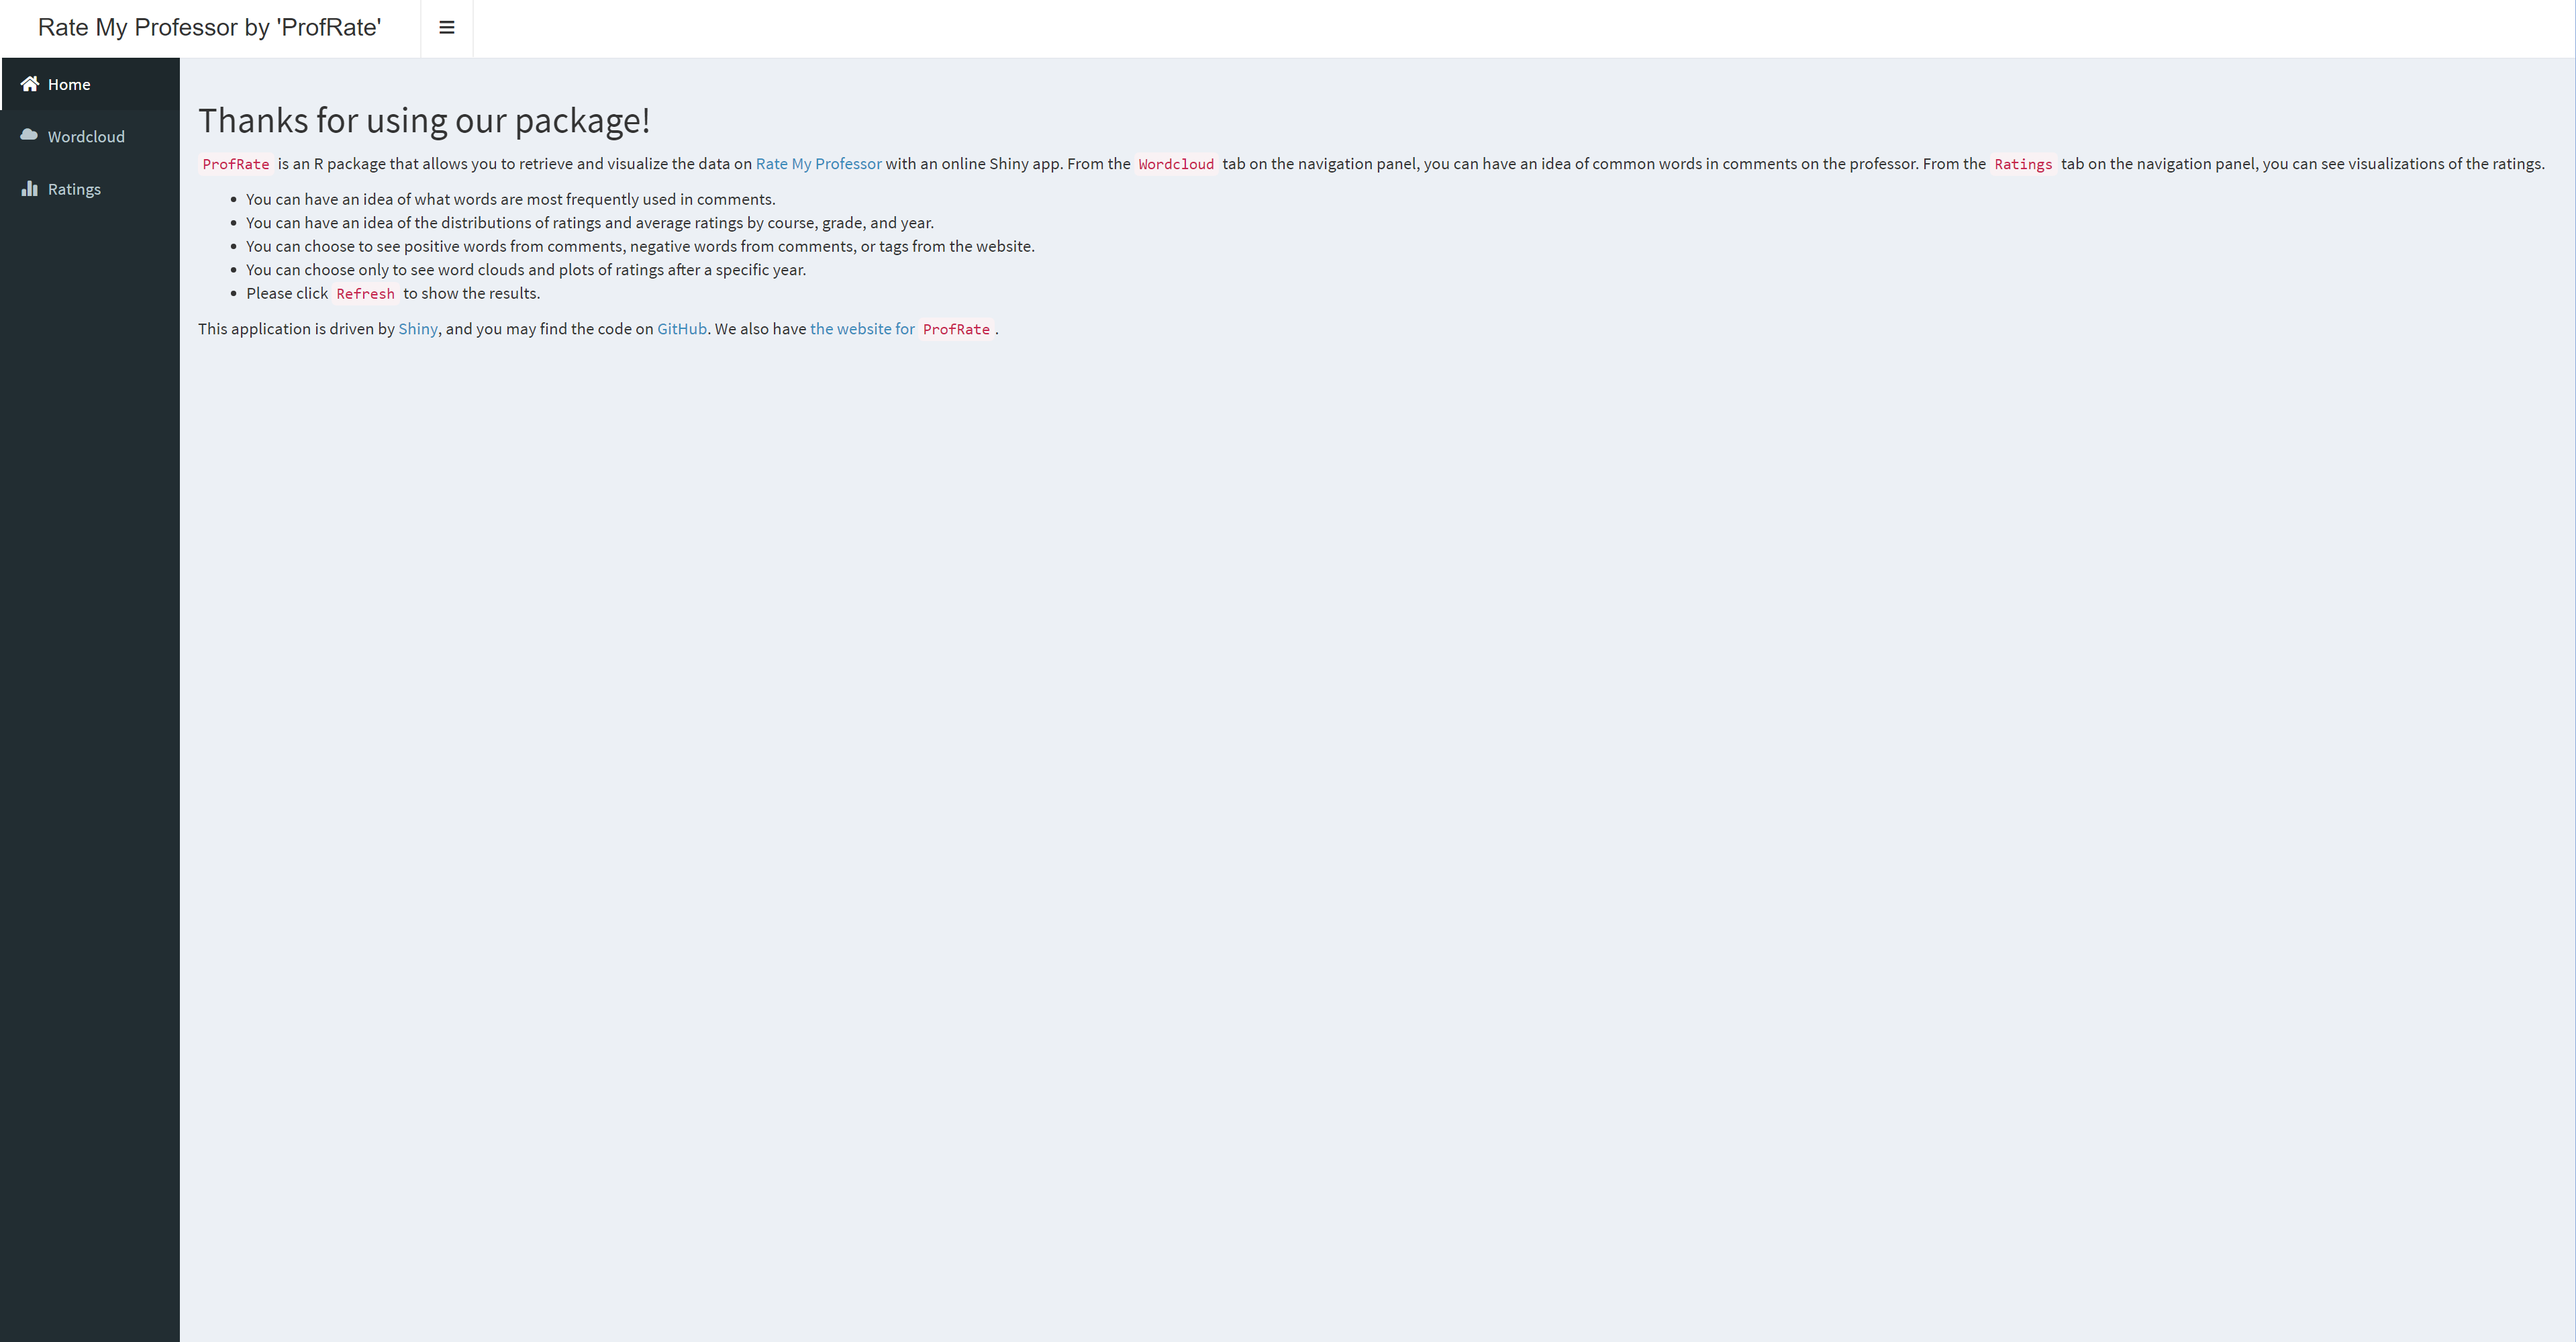
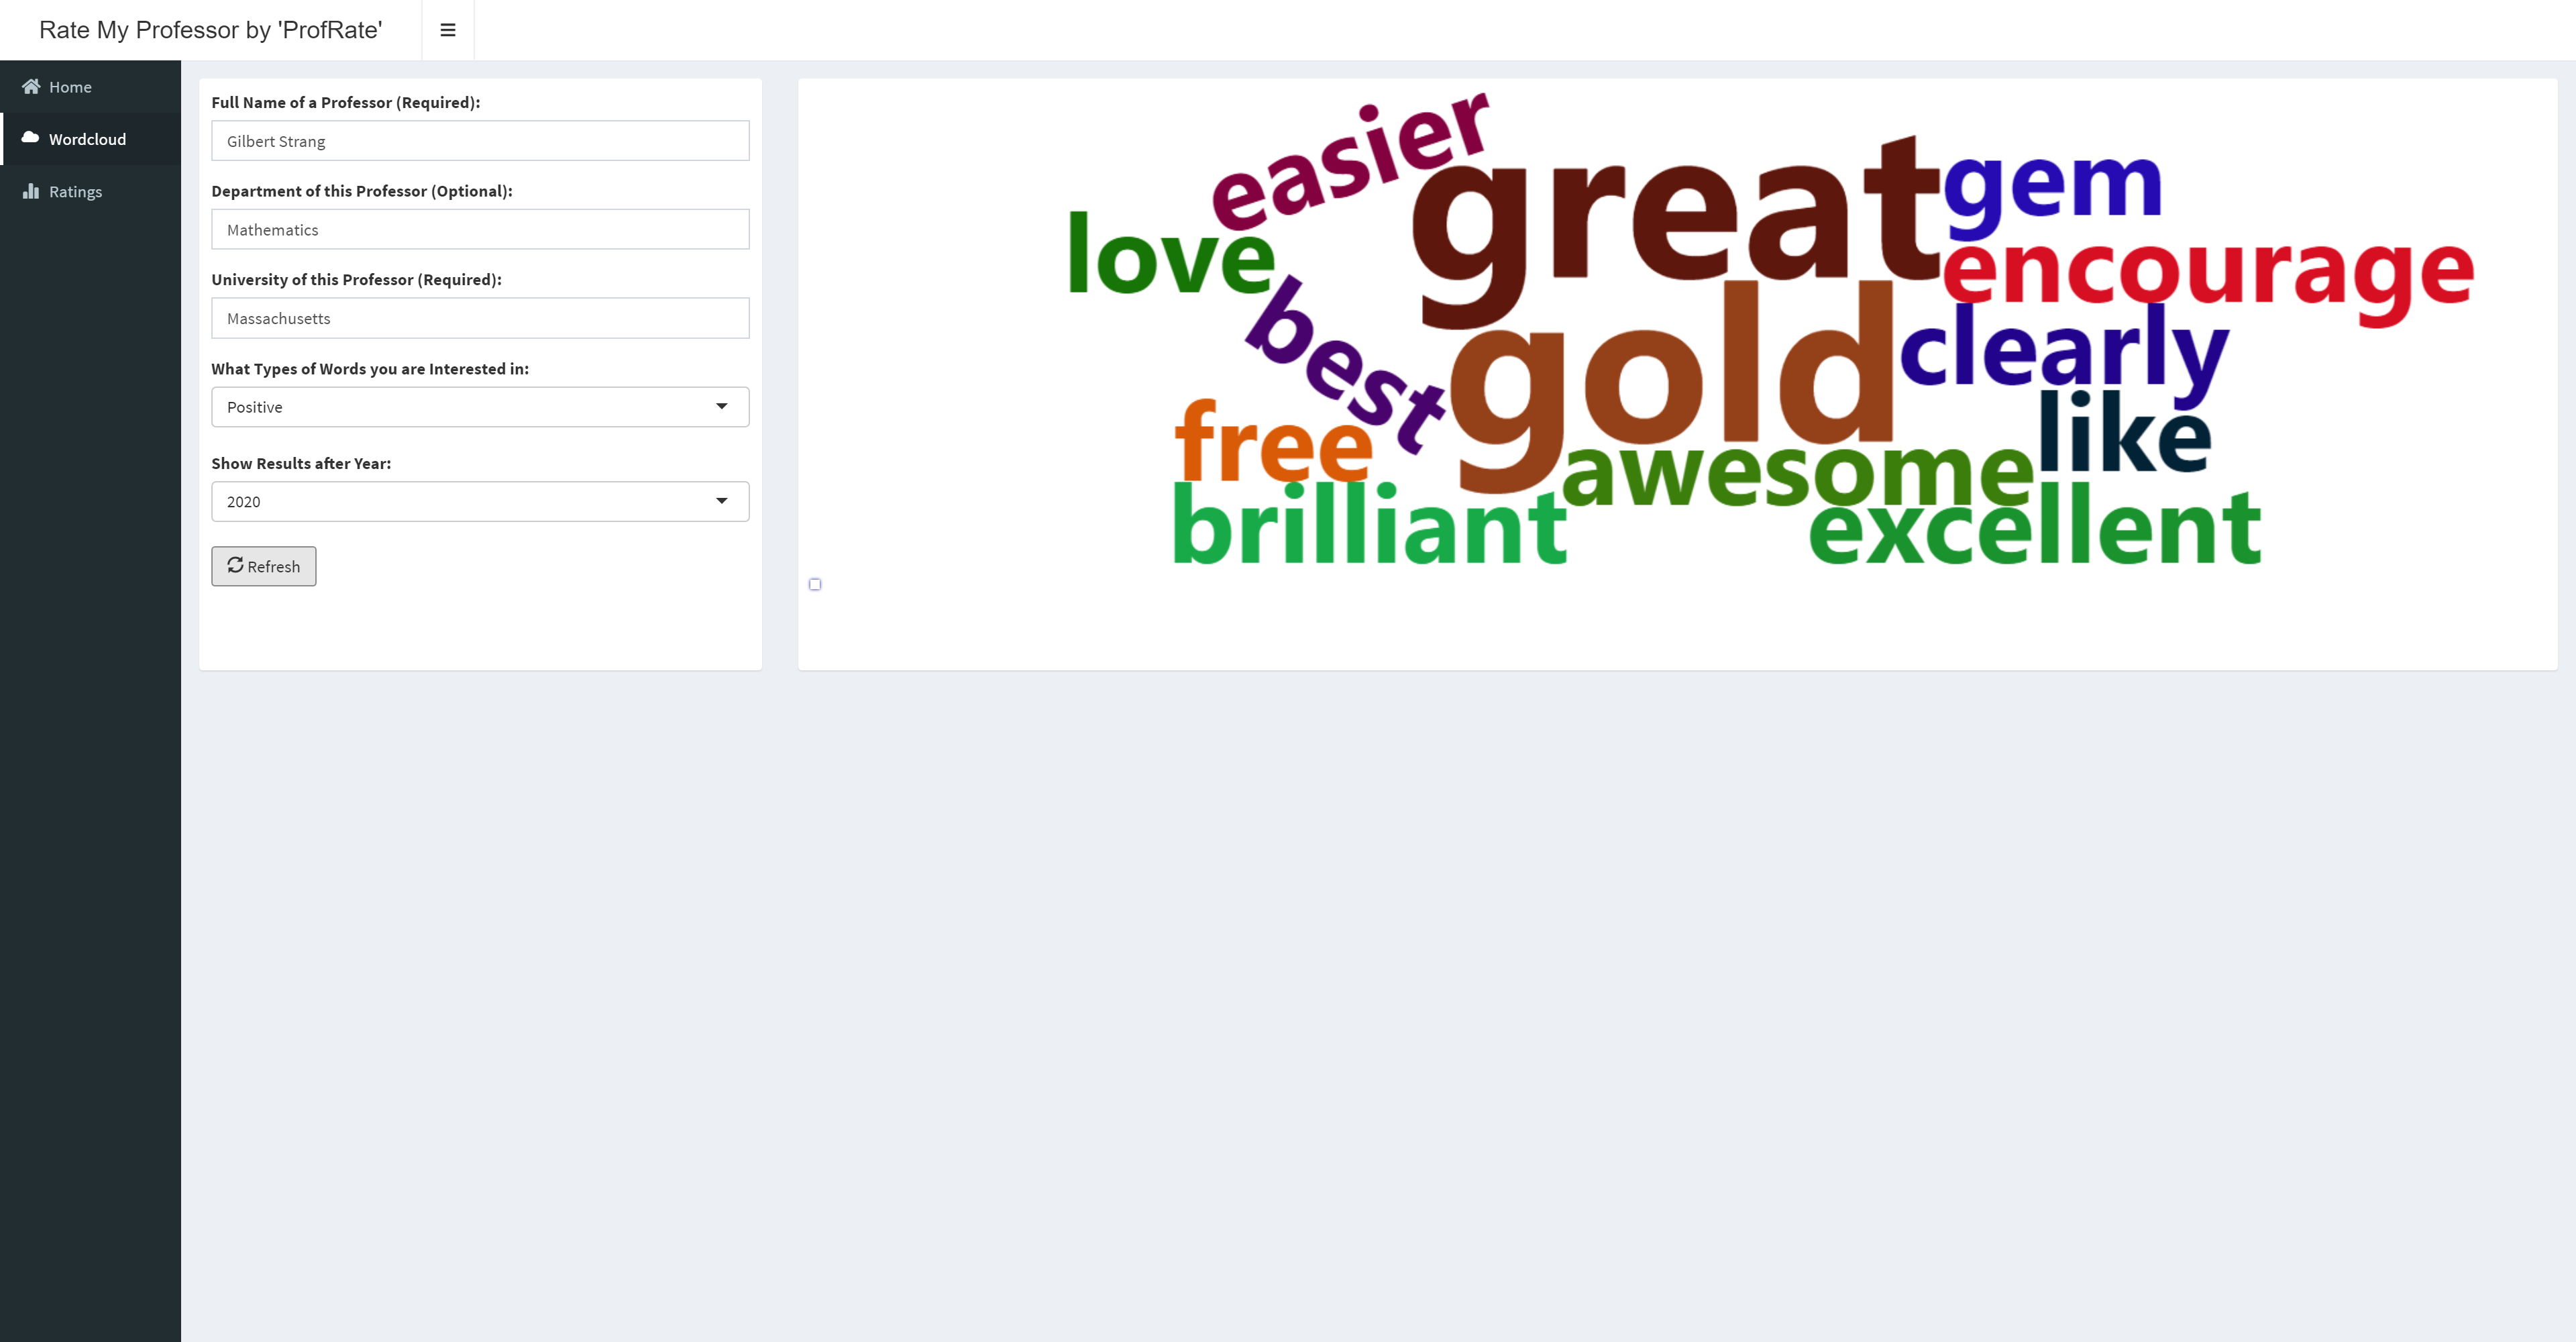
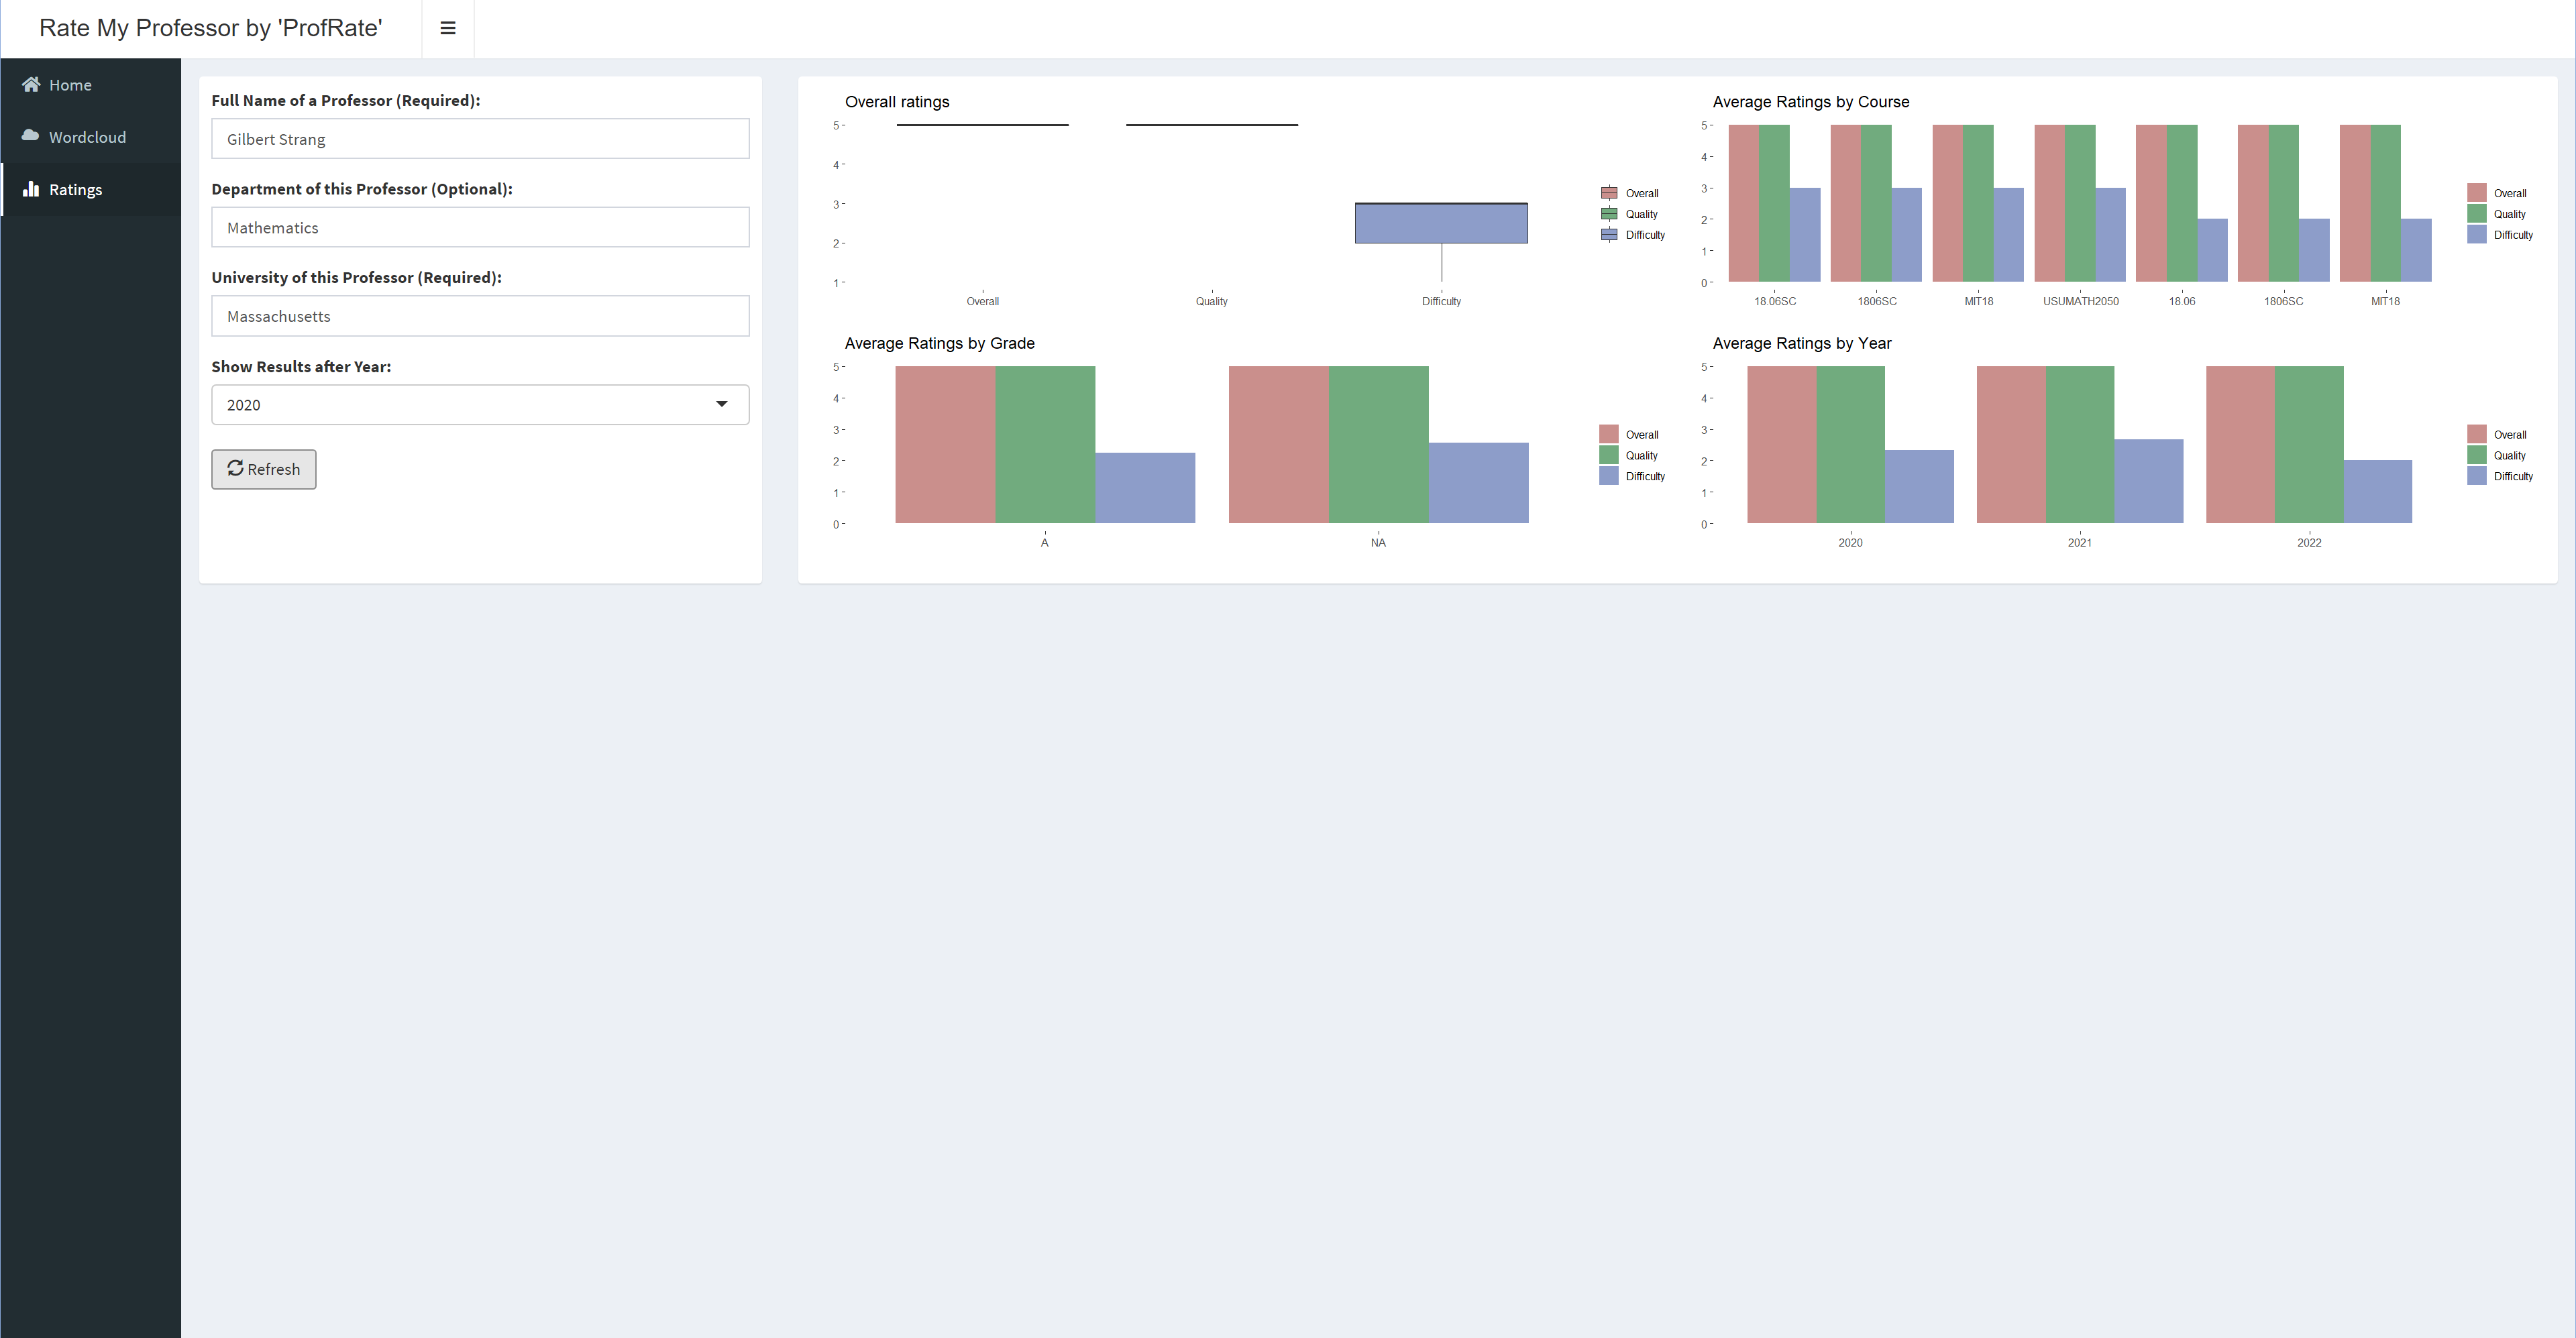
As introduced before, the runExample function is used to launch our well-designed Shiny dashboard. The dashboard is highly comprehensive and user-friendly. Most importantly, it utilizes and shows all the functionalities discussed so far in an interactive way. We include some screenshots of the Shiny dashboard below.


Future Steps
Here are the future steps to make this package more comprehensive.
Adding campus evaluation to the analysis as well as the Shiny dashboard.
Incorporating correlation analysis and outlier detection:
- Relation between the ratings and grades
- Relation between the comments and grades
- Incorporate likes and dislikes into the analysis to emphasize the value of comments.